Начало работы
Работа с платформой
Обзор админ-консоли perfscale — машины, конфигурации, тесты и результаты
Админ-консоль — место, откуда вы управляете perfscale из браузера:
подключаете генераторы нагрузки, задаёте профили нагрузки, пишете и запускаете
тесты, читаете результаты. Вход по адресу /admin вашего инстанса (например,
perfscale.su/admin). Хотите сначала осмотреться?
На странице входа есть кнопка Try the demo — она заполняет данные
демо-рабочего пространства (только чтение).
Вход — пароль, SSO и привязанные аккаунты
Страница входа /login принимает email и пароль, а в зависимости от
инстанса — и вход в один клик через SSO: Yandex и GitFlic на
perfscale.ru, Google — на международном
perfscale.su. Если у провайдера тот же email, что
и у существующего аккаунта, они привязываются автоматически — без писем с
подтверждением.
Вкладка Аккаунт (/admin/account) показывает все социальные провайдеры
инстанса со статусом каждого: Linked as с вашим именем у провайдера или
Not linked. Кнопка Link запускает привязку через Keycloak: браузер
уходит на страницу согласия провайдера и возвращается уже привязанным.
Unlink сначала спросит подтверждение; Keycloak может отказать в отвязке
последнего оставшегося способа входа — тогда на странице появится его сообщение
об ошибке.
Так один человек держит несколько способов входа — скажем, и Yandex, и GitFlic — привязанными к одному аккаунту perfscale.
1. Машины — ваши генераторы нагрузки
Машина — любой хост с агентом perfscale: физический сервер, VM, контейнер или облачный инстанс. Страница Machines показывает их с регионом, ёмкостью (сколько виртуальных пользователей тянет каждая), статусом и живой задержкой.
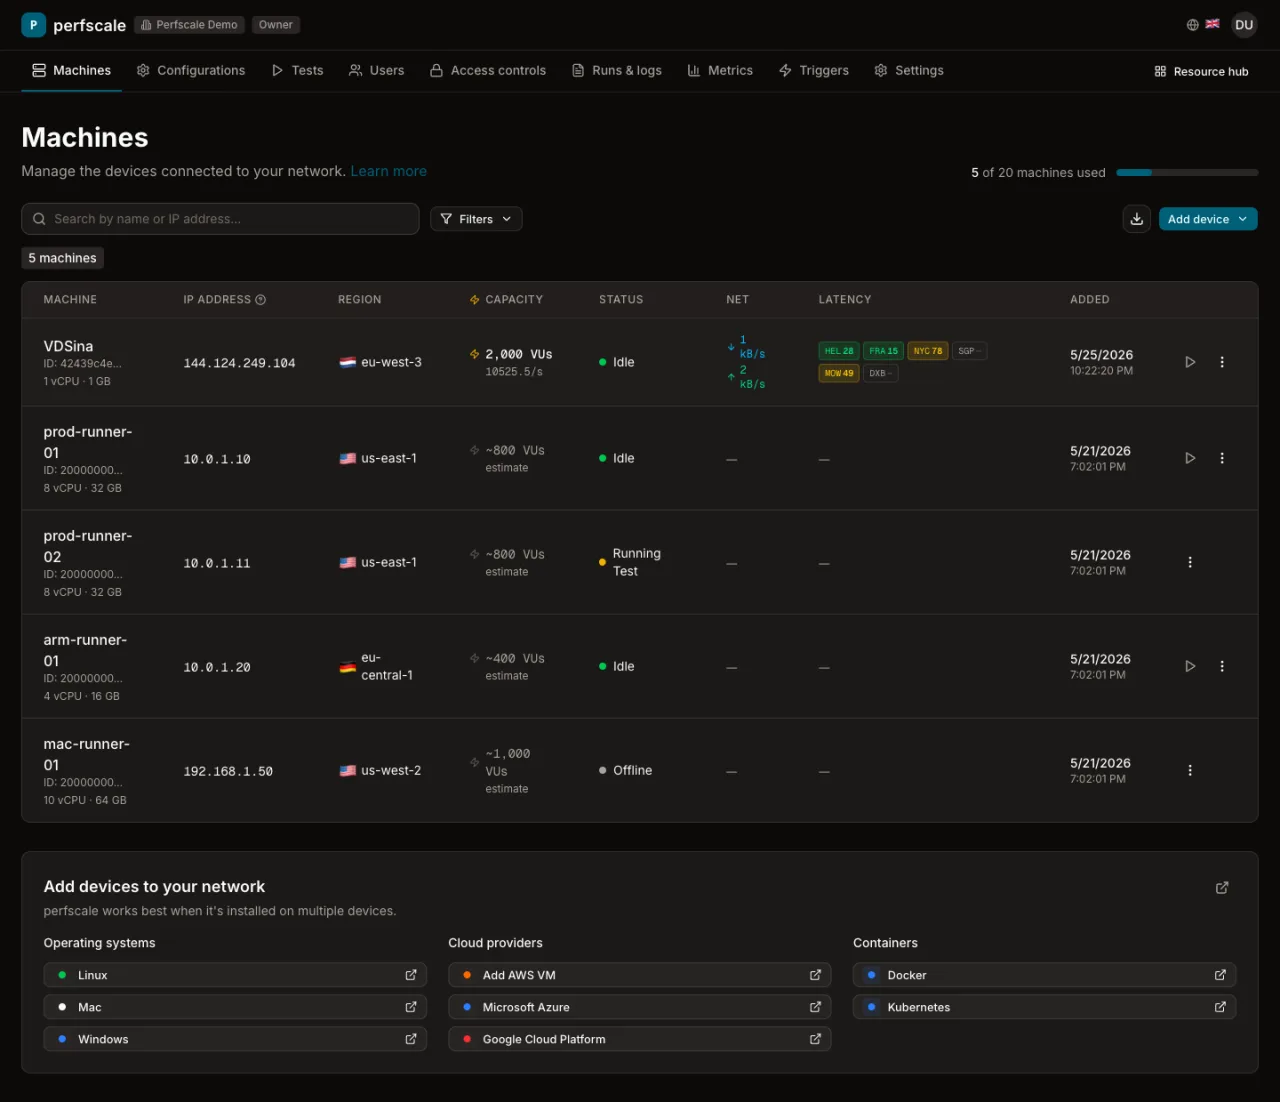
Добавьте ёмкость через Add device — панель внизу содержит однострочные сниппеты установки для Linux, macOS и Windows, а также для AWS, Azure, GCP, Docker и Kubernetes. Агент регистрируется сам и появляется здесь за секунды. См. Machines — жизненный цикл и статусы.
2. Конфигурации — профили нагрузки и переменные
Configurations — переиспользуемые профили нагрузки: сколько виртуальных
пользователей, как долго, с каким разгоном. Встроенные пресеты (debug,
smoke, load, stress, spike, soak) совпадают с пресетами CLI; можно
добавить свои профили с фазами разгон / плато / спад. Конфигурация может
также нести блок report:: включите during_run (сниппет During-run
metrics в редакторе) — и нативные прогоны начнут стримить живые метрики на
страницу прогона. См. Стриминг живых метрик.
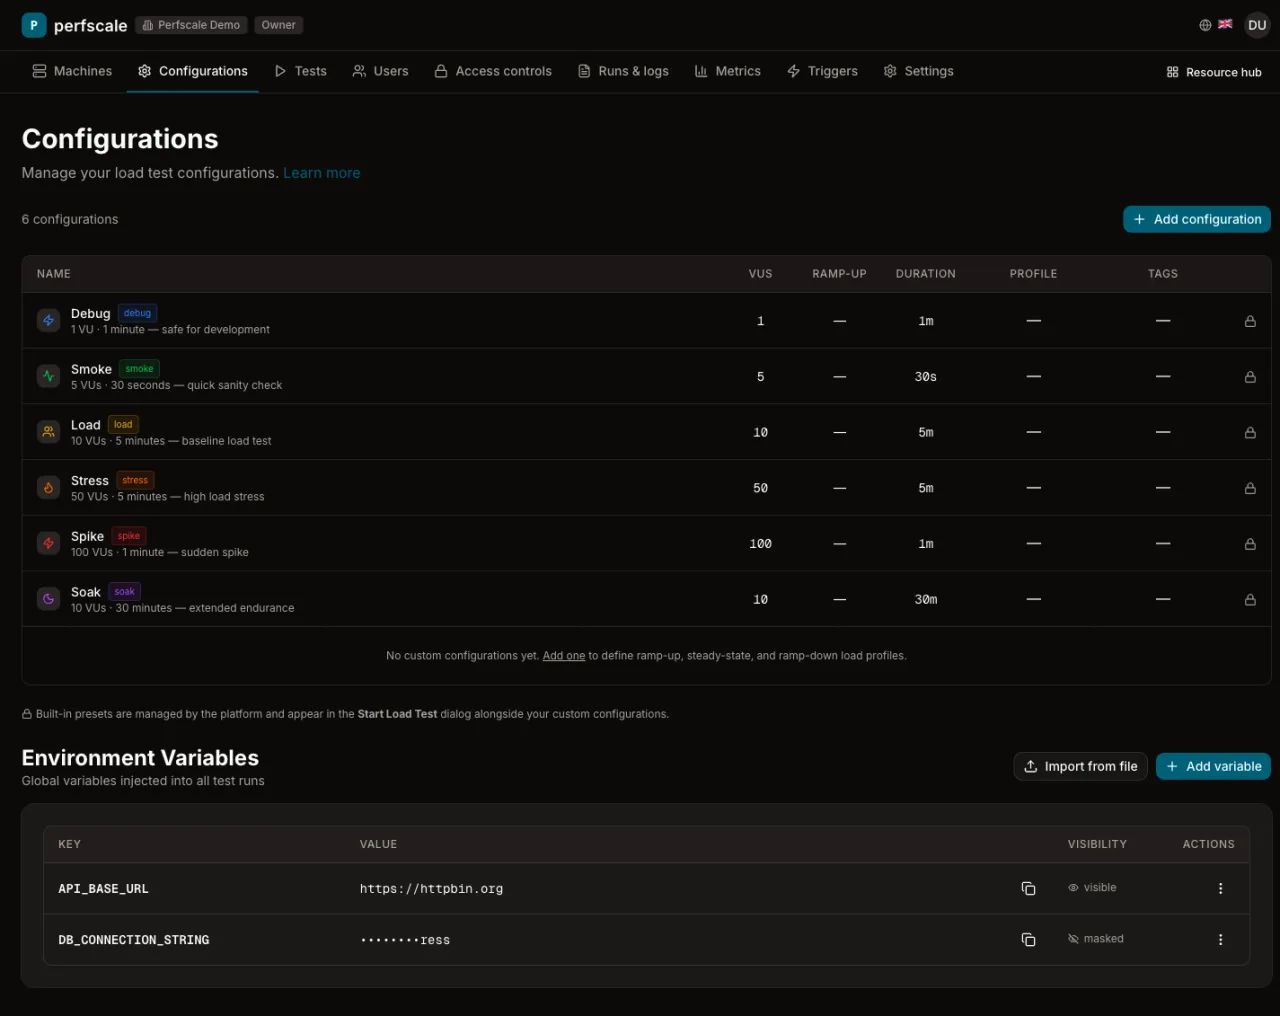
На этой же странице — Environment Variables рабочего пространства:
значения, на которые ссылаются тесты (API_BASE_URL, токены, строки
подключения), и реестр, по которому платформа вырезает секреты из всех
логов. Пометьте значение masked, чтобы вырезать его везде, где оно может
появиться. См. Переменные окружения.
3. Тесты — написать и запустить
Тест связывает скрипт (k6, JMeter, Locust или нативное YAML-описание шагов perfscale) с конфигурацией. У редактора есть виды Code, YAML и Visual; правая панель показывает доступные переменные окружения.
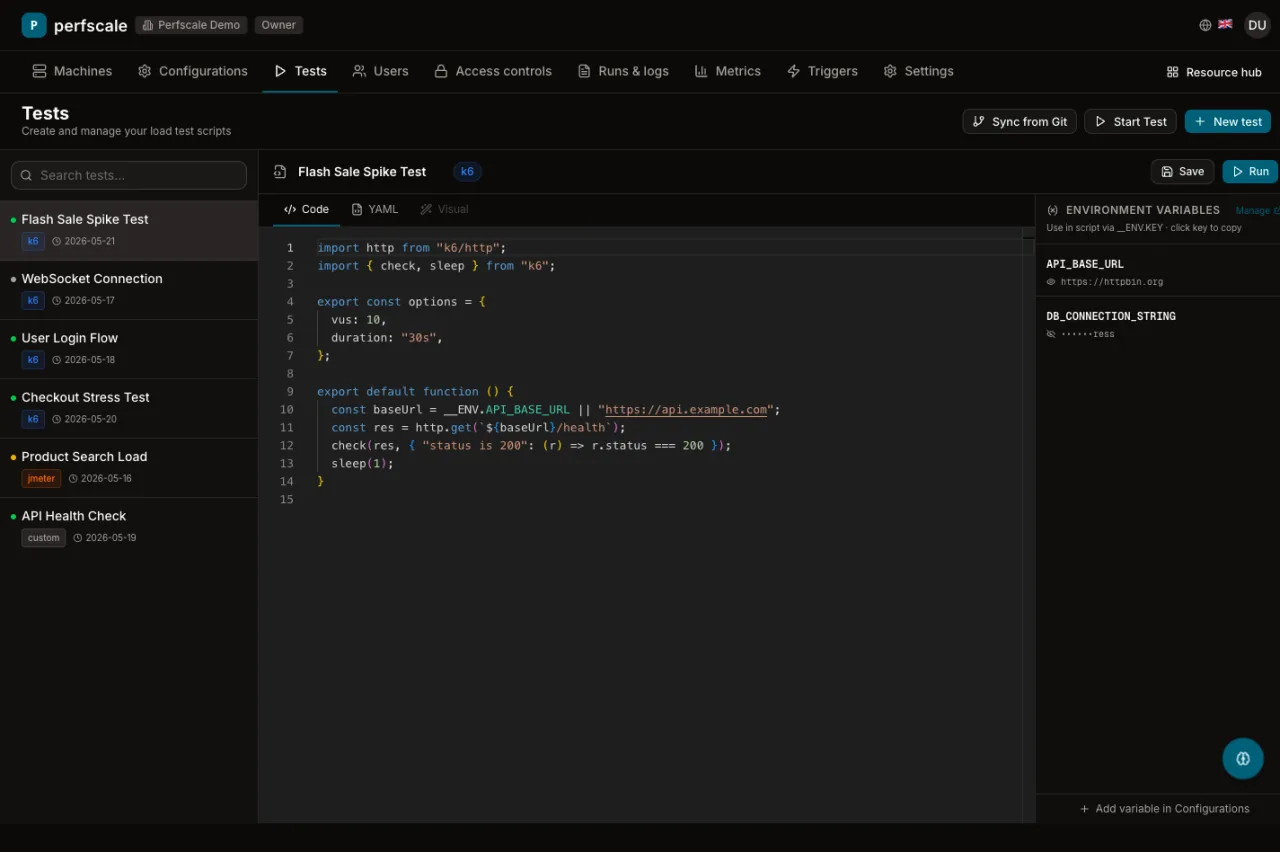
Нажмите Run (или Start Test, чтобы выбрать машину и конфигурацию) — и запуск уедет на свободную машину. Можно также Sync from Git, чтобы держать тесты под контролем версий. См. Tests & Tasks — жизненный цикл теста и задачи, и Интеграция с Git — синхронизацию и уведомления о прогонах.
4. Runs & logs — наблюдать за выполнением
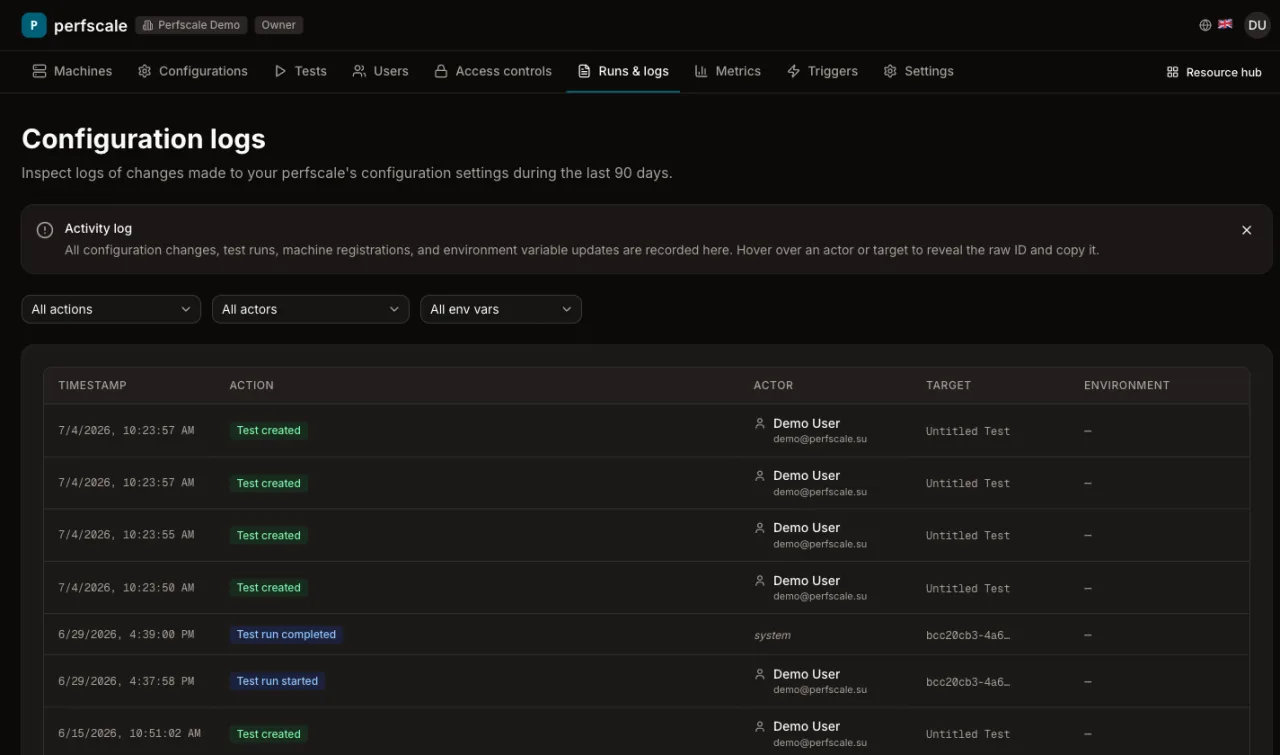
Каждый запуск стримит вывод в Runs & logs: диспетчеризацию, построчные запросы, результаты проверок и финальную сводку метрик — с таймстампами и фильтрами.
Агрегированные перцентили задержки и пропускная способность попадают на дашборд Metrics, а весь процесс автоматизируется через Triggers (расписания и вебхуки) или REST API.
Дальше
- Quick Start — запустите первый тест.
- Machines и Tests & Tasks — базовые концепции.
- Протокол FIX — нагрузка на торговые площадки (Scale и Enterprise).